Finding campaign results in Matomo
Archived article
Matomo is no longer used but this article has been kept for record.
If you’re used to Google Analytics (or have read my campaign guide to GA) then Matomo will be quite an alien place.
If you’ve never used a web analytics tool before, then Matomo will be quite an alien place.
So we’re all in the same boat.
But don’t worry!
This guide is here to help you find your campaign results.
Included in this guide
Also recommend: Link tracking manual and How to filter Matomo tables.
How to access Matomo
Matomo can be found at https://hud.matomo.cloud This is the University’s own instance of Matomo.
To request a login please email webteam@hud.ac.uk but please note, there are a very limited number of account licenses so we operate a rotating seat scheme. This scheme means if you don’t log into your Matomo account in a 30 day period then your account may be revoked to free it up for other people.
How to find your campaign results
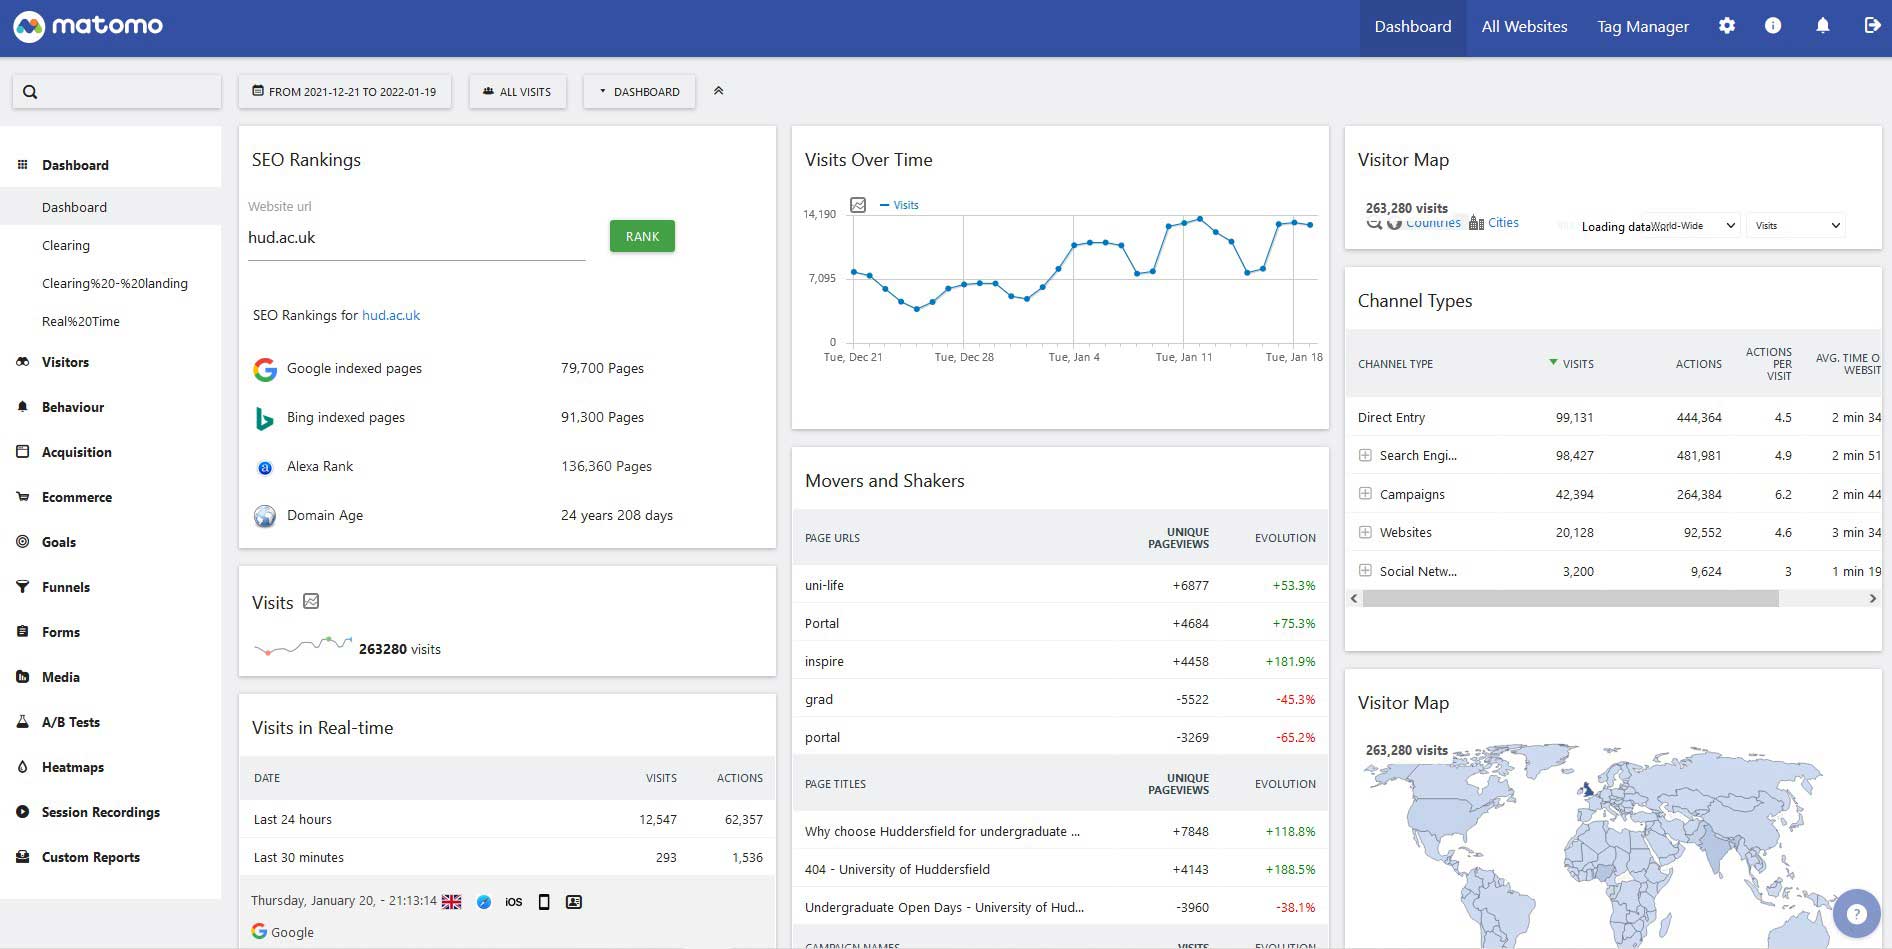
This is what Matomo looks like when you first login.
There are two reports to look at depending on what you want to know about your campaign tracking.
- Campaign report – visits, bounce rate, time on page, how many actions users took on average
- Goal report – how may conversions your tracking received across all goals.
Find the campaign report
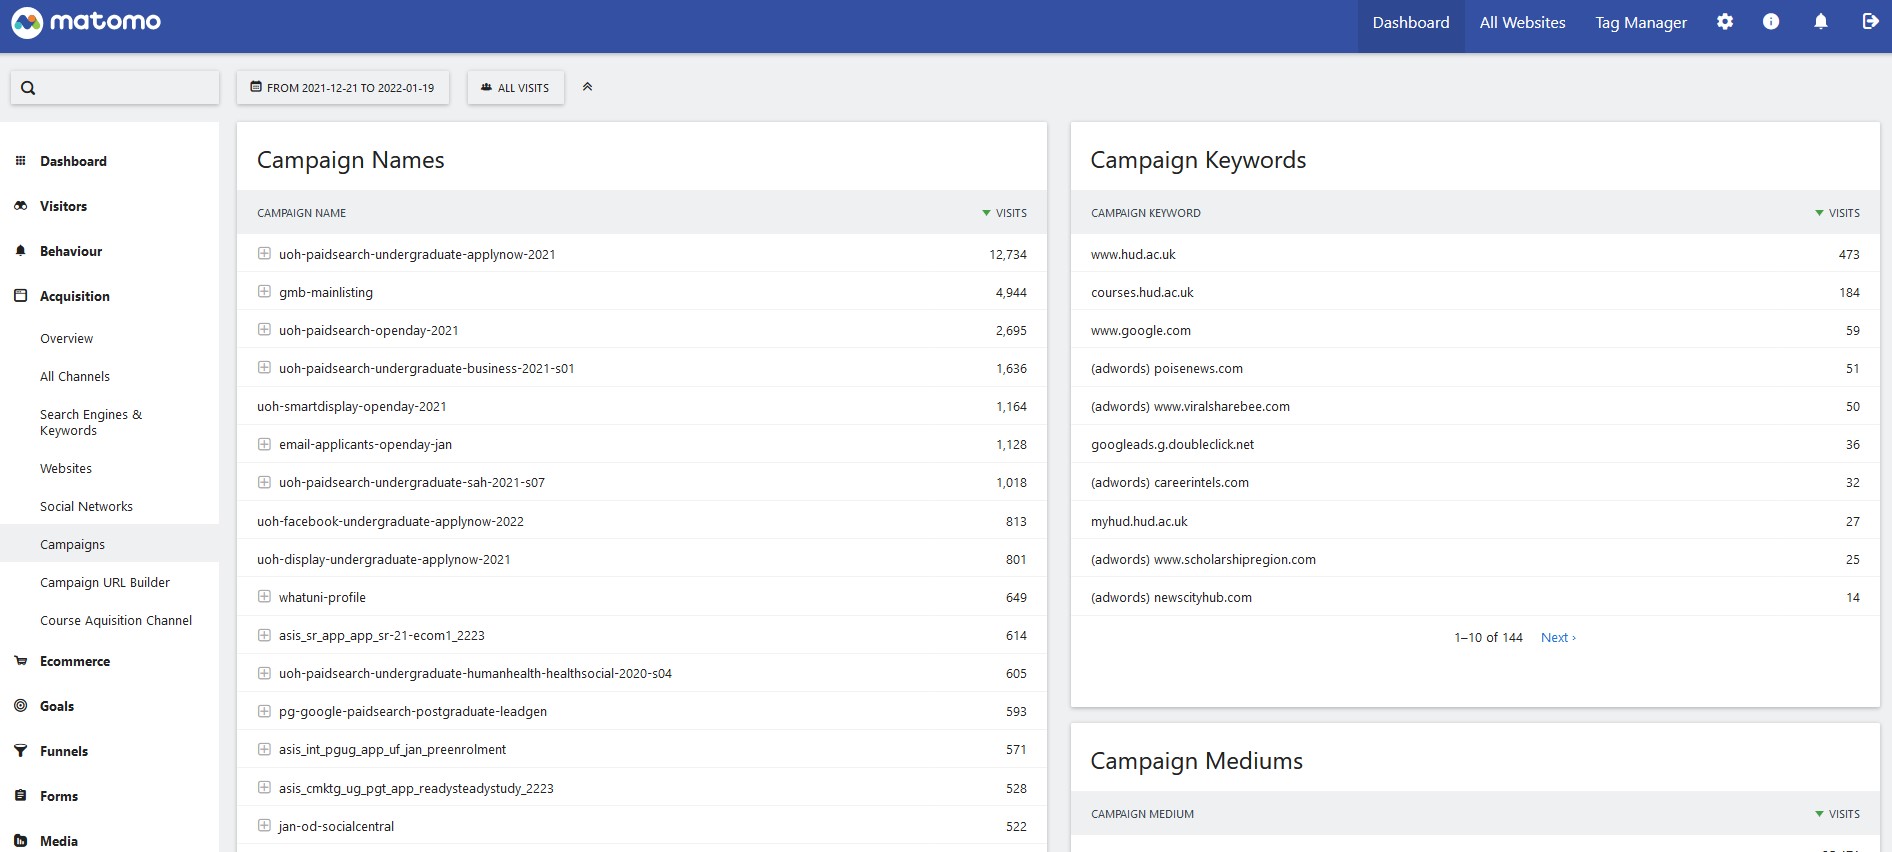
To find your campaign results the menu (navigation) is on the left hand side of your screen. You’ll need to go to Acquisition > Campaigns. The report looks like this:

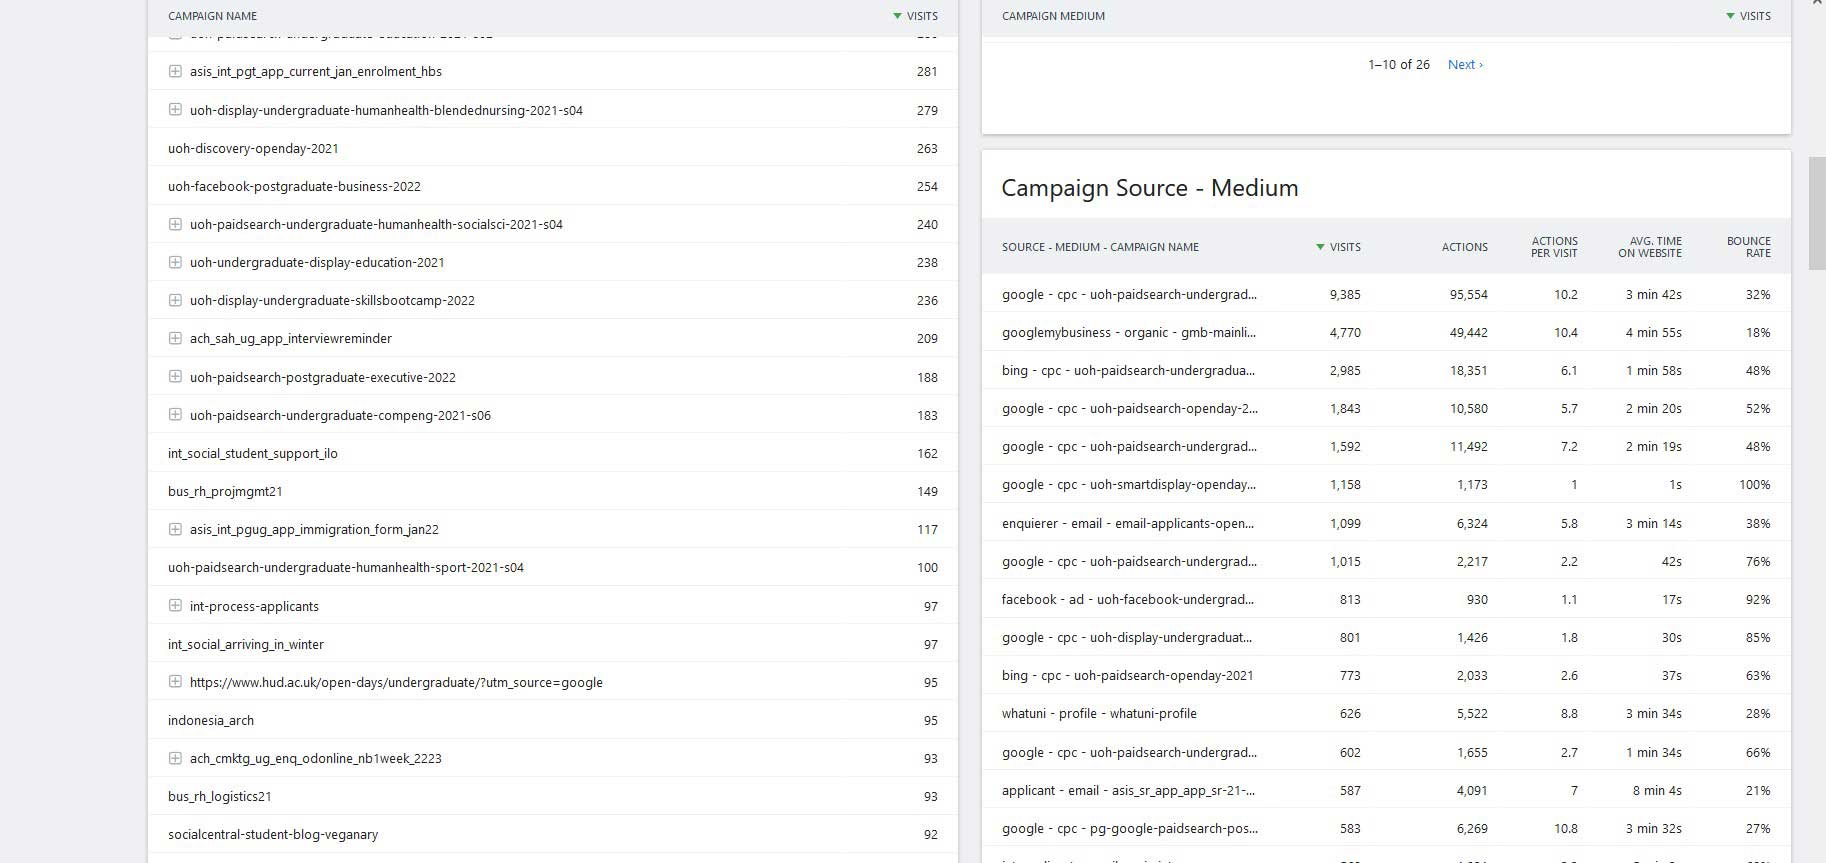
Then scroll partway down to find the table titled “Campaign Source – Medium”. I find this is the most useful table in this report. To note, every table in Matomo can be filtered which will make finding your specific campaign easier. I’ve written a separate guide on how to filter tables in Matomo. (not yet published)
Find the Goal report
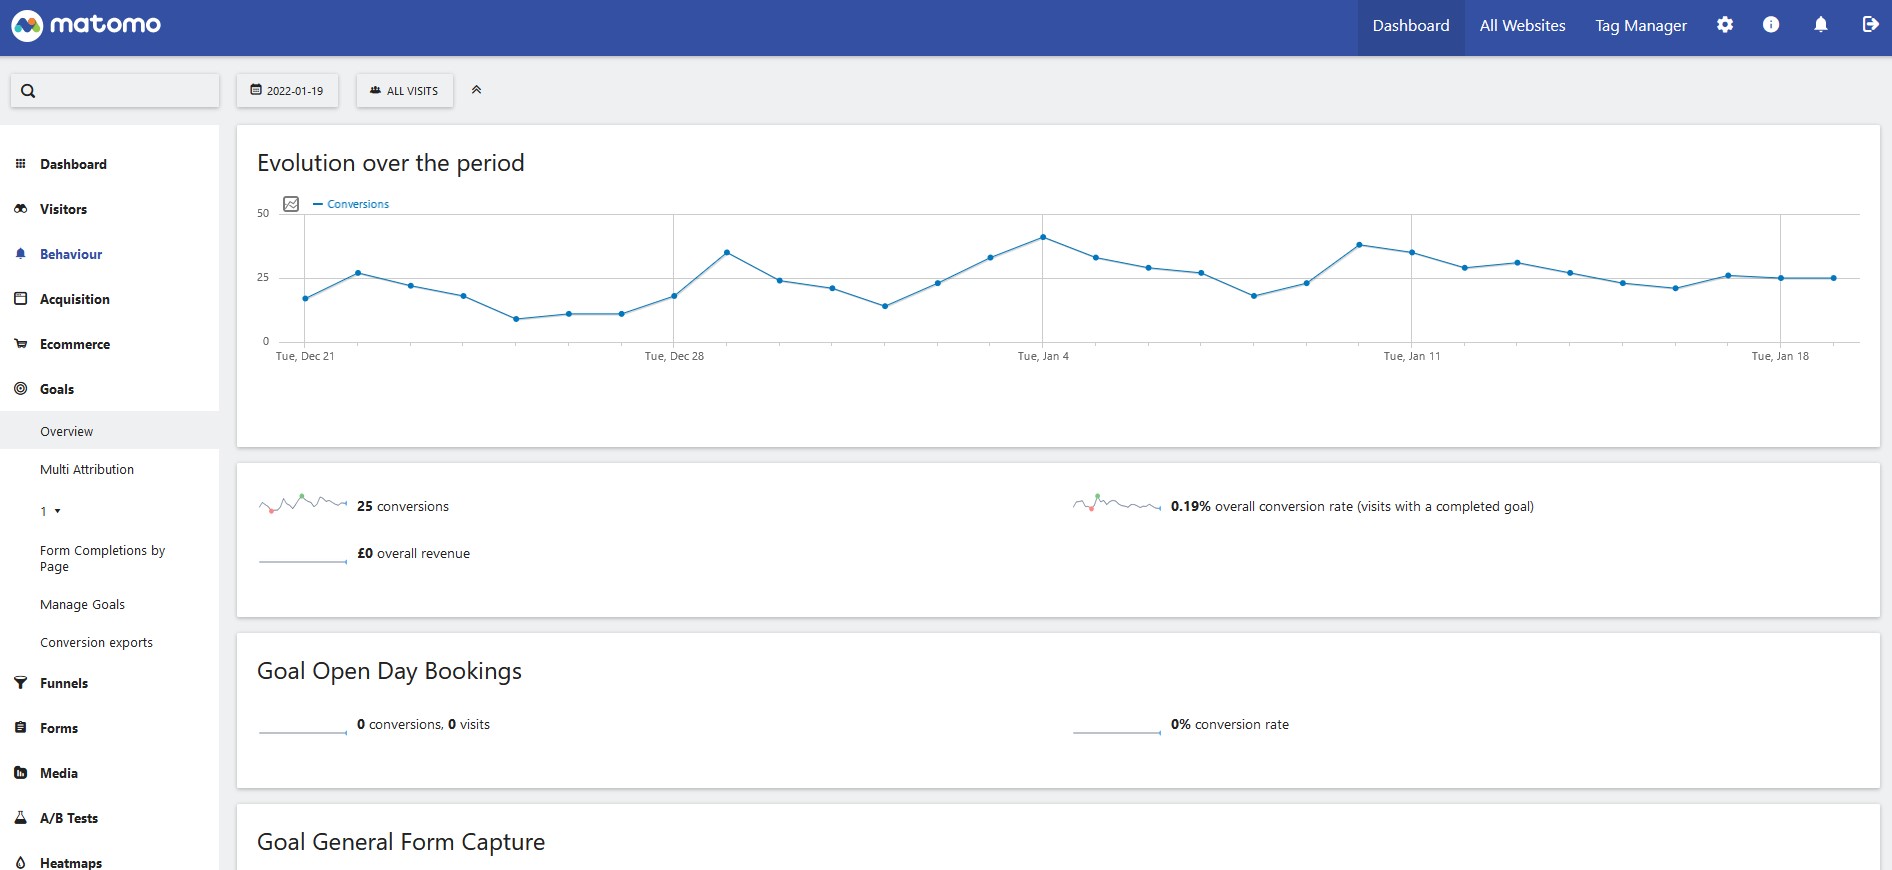
To find this report you’ll need to use the left hand menu and go to Goals > Overview. This is perhaps the most useful of the two reports and I'll show you why after the screenshot.
You should be looking at a report like this:
Scroll down and you’ll find a number of extra reports that can be selected. It should look like the screenshot below:
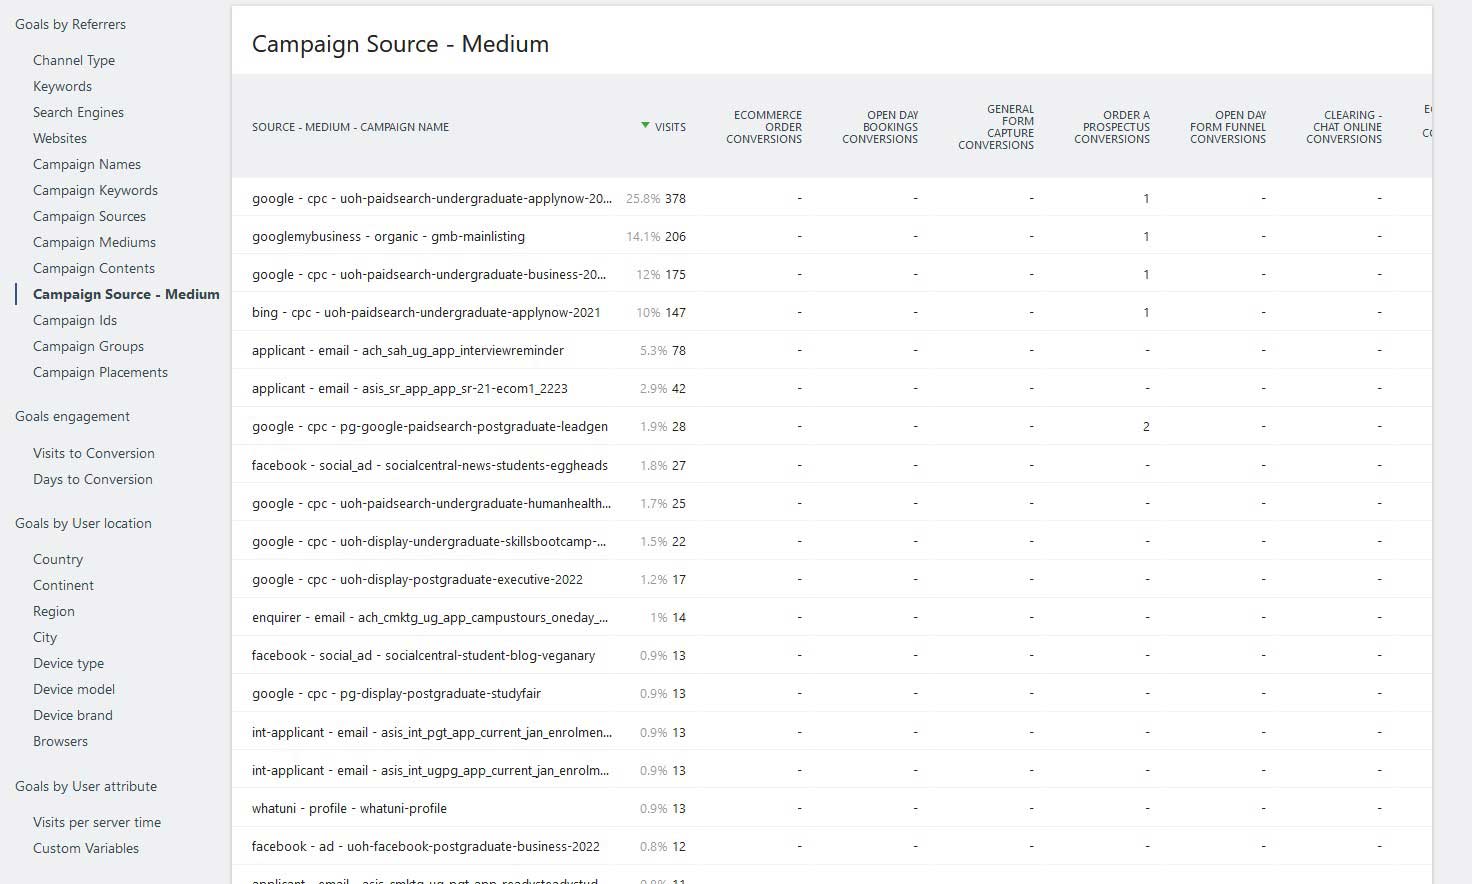
From this report you can see all of the campaigns alongside the goals. And there are a number of different reports on the left hand menu that can be looked through.
Note, there is a horizontal scroll bar at the bottom of the report so you can scroll right.

Nate Smith
Web Content Analyst, assigned to the Digital Content Team
Expert in web content, site architecture, analytics and content design. If you have any questions about these subjects please contact the Digital Content Team on digitalcontent@hud.ac.uk