Overview
WiDR is a Google Chrome Browser Extension. It is a tool developed by the WebTeam, specifically to assist you in the workflow process. The current workflow process looks like this:
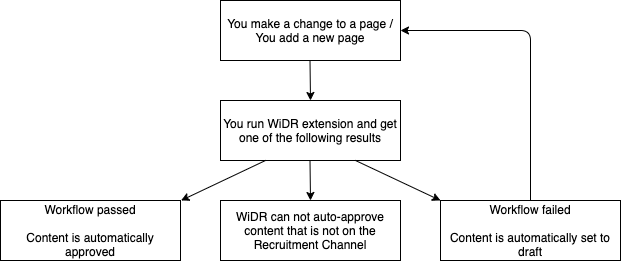 Workflow Diagram
When you initiate WiDR, it scans the page content against set criteria, and will identify any issues that prevent approval.
Using WiDR means no wait time for the WebTeam to review your changes. If the workflow fails when the WiDR extension is ran, you will be presented with reasons why, and your content will be set from pending to draft. If you correct the issues reported and re-run the WiDR tool, your content will be set from pending to approved with immediate effect.
Installation
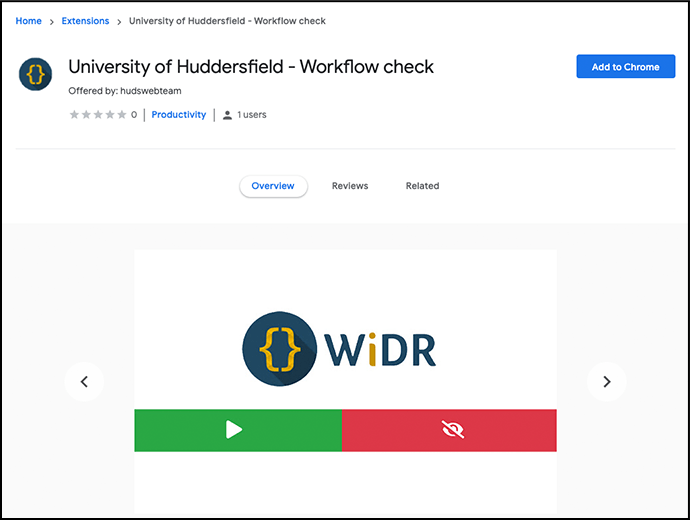
First, ensure you are using the latest version of the Google Chrome Browser, then go to the WiDR extension on the Chrome Web Store.
Select the 'Add to Chrome' button as shown in the screen shot below, and then select the 'add extension' button in the pop-up (also shown below) which will display soon after selecting the 'Add to Chrome' button.
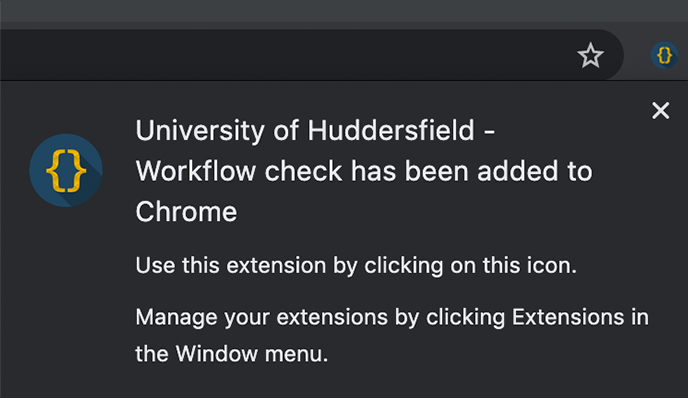
You may notice that a file appears to be downloading, and the 'Add to Chrome' button changes text to 'checking'. Wait. Once it has finished, a further pop-up (also shown below) will confirm the extension has been successfully added to Chrome, and you will see the icon in the tool bar.
NOTE: If using UniDesktop, this tool will be installed already. Once you open UniDesktop, it may take 1-2 minutes to show. You can find it by selecting the jigsaw icon in the browser toolbar - this icon shows you all your installed extensions. To open the extension, simply select it from this list.
Usage
Navigate to a page on T4, and select the preview icon to open the preview page in a new tab. Wait until the page has fully loaded before opening WiDR (the cross icon changes to a circle with arrow when the page has finished loading).


To open WiDR, select the WiDR icon which was added to the Google Chrome browser toolbar on successful installation.

The WiDR extension is displayed like a pop up, and will remain fixed in that location (towards the top right of the browser window) until removed. It cannot be dragged around the screen. To remove it from your screen, click anywhere else on the page.
Now, with the extension open, you can run the page test. To do this, press the green play button. You should see a loading bar appear, and work up to 100% as the extension scans the contents of the page.
Once the test is complete, you will be presented with the results. It will be obvious if your page passed or failed.
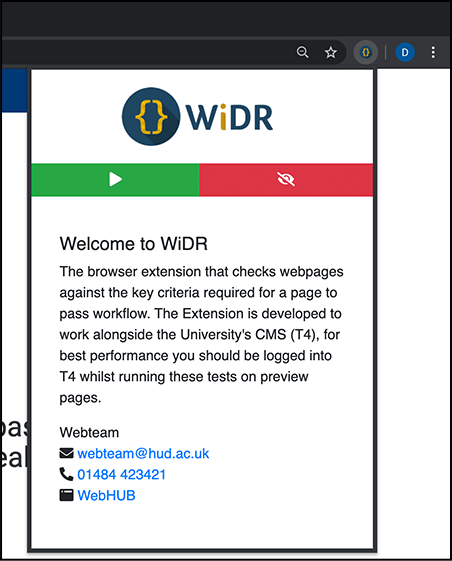
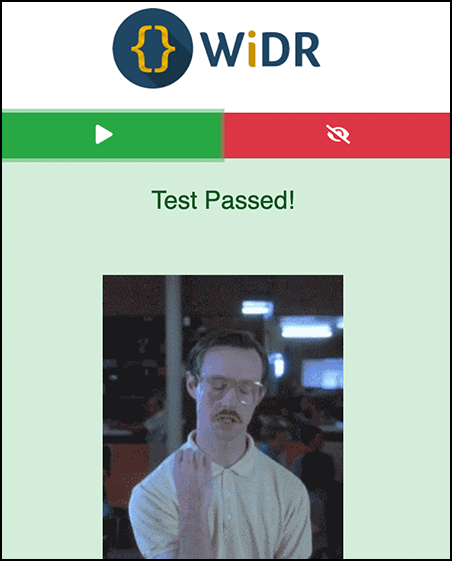
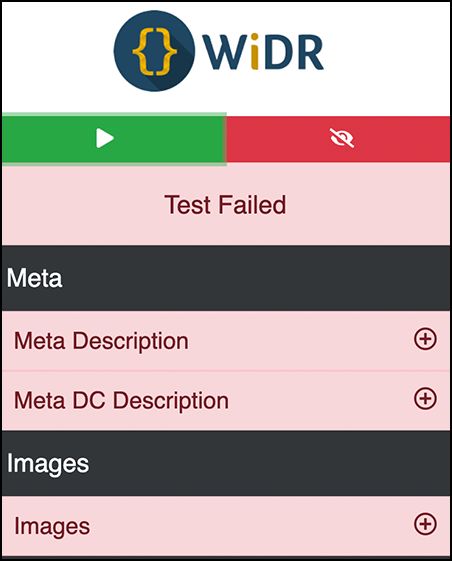
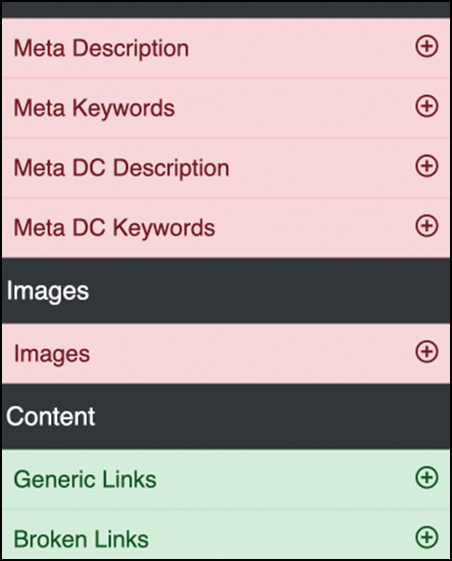
Next to the play button is a red button with an eye icon. This is a toggle button, and it shows and hides sections that have passed the test. So after a test has completed, press once and you will seen green headings on any passed sections. Press again and these are hidden
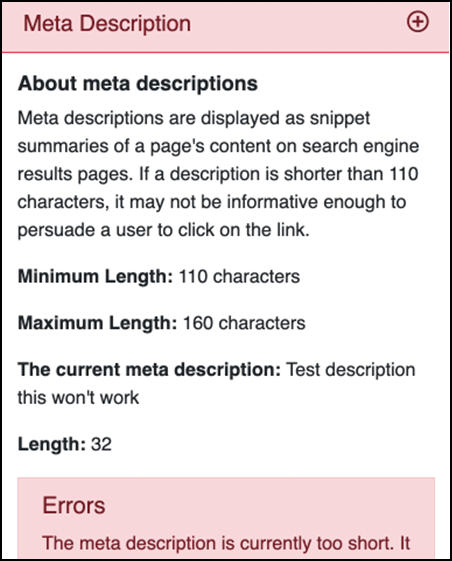
When you select an individual test, the box will expand and you will see the results. In this case, Meta Data failed. You can see what the requirements for this is, and what the current data is.
In cases where it is possible to highlight the error on the webpage (which is all failures excluding Meta), then on expanding a particular test you will see a red border around the element in question. In this case WiDR identified a generic link error, and we have expanded that section. When you select the same section again, it will minimise the section, and the highlight will disappear. In cases where the error is inside a modal, simply open the modal to see the highlight, however please remember when you click off the extension, the extension will disappear.

On pages where there are a lot of links, you may find the test takes longer to complete that usual.
Please reload the page completely and try again if:
- WiDR does not run the test (it is likely you have opened it before the page loaded fully)
- You click off the results, meaning they have disappeared, but you want to see them again
- You move from one page to another without a reload between tests, and the second test does not run
