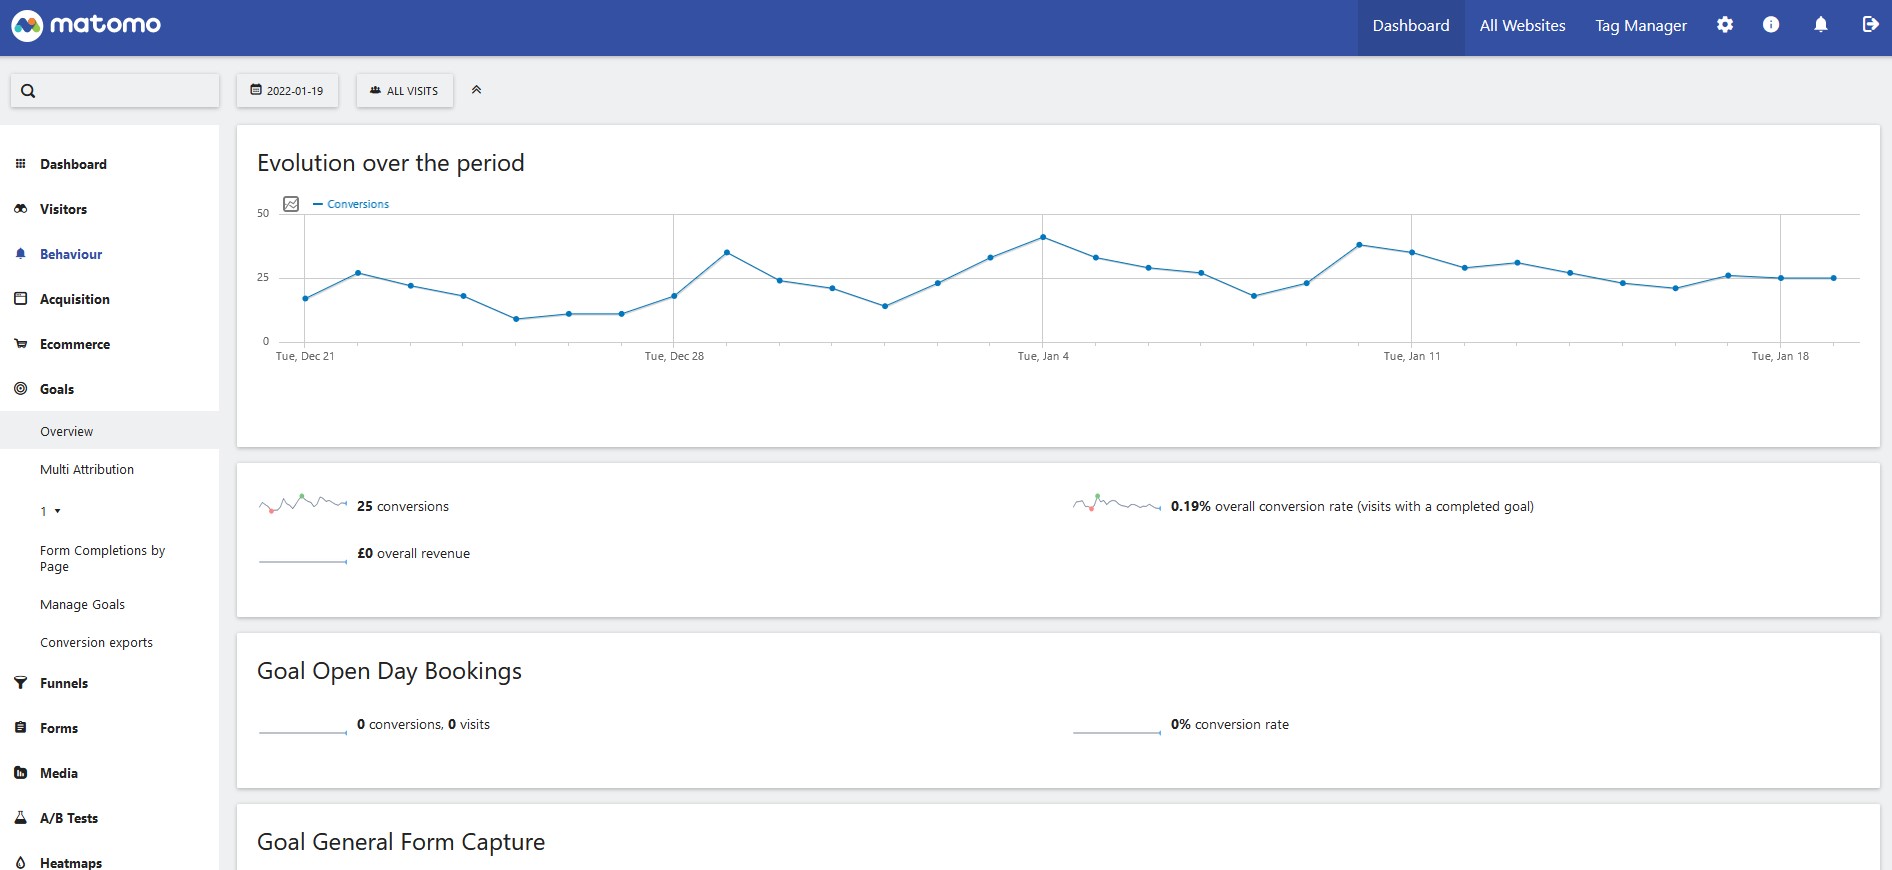
How to filter tables in Matomo
Archived article
Matomo is no longer used but this article has been kept for record.
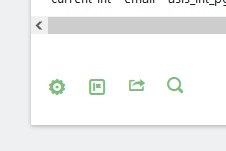
Matomo likes to a hide its option menu at the bottom of each table and they only appear on hover. No idea why they’ve done it like this, but that’s the way it is.
Scroll to the bottom of any table/report, hover your mouse over the bottom left corner and 4 icons will appear.
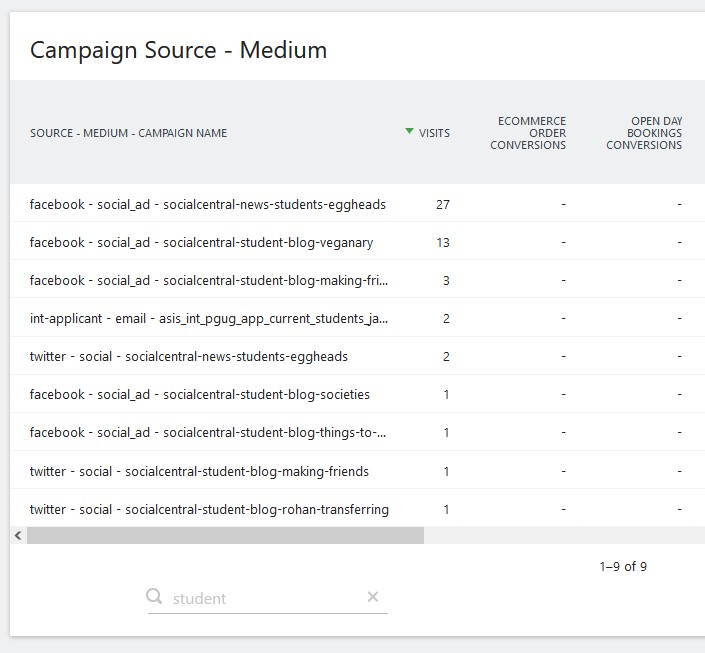
Search
Lets start on the right with the magnifying glass, or the search option.
Type the name of your campaign or a unique part of the campaign name then press enter. The table will then be filtered to match your search.
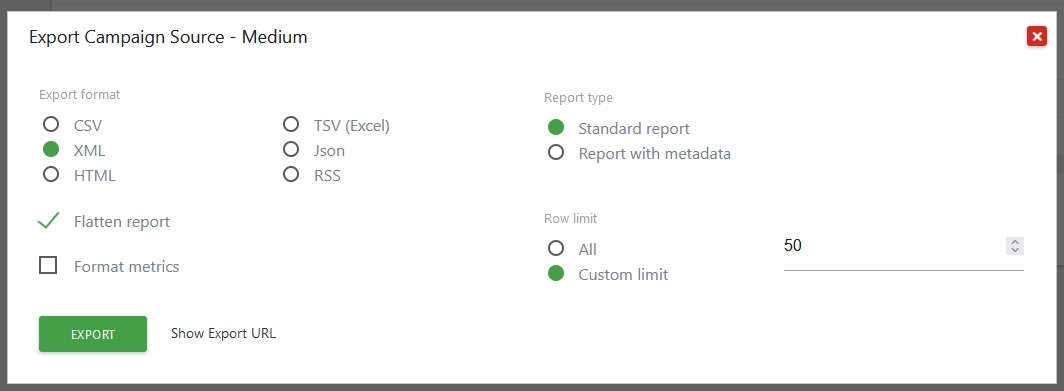
Export table
Next along (going left) from the Search option is the Export Report button.
Click it and a modal will appear with a number of export options.
Choose the options you want then hit the Export button.
Change visualisation
The change visualisation item gives different options depending on the report you’re looking at. For me I’m looking at the Goals report so these are the options:
- Display simple table
- Display a table with visitor engagement metrics
- Display a table with Goal metrics
- Insights
- Vertical bar graph
- Pie chart
- Tag cloud
Simple table
Shows the tables dimension (in my example it’s the source, medium and campaign) along with unique visitors
Table with visitor engagement metrics
This adds extra metrics such as average time on website, bounce rate and actions. Actions are things users do on the website such as click a link etc.
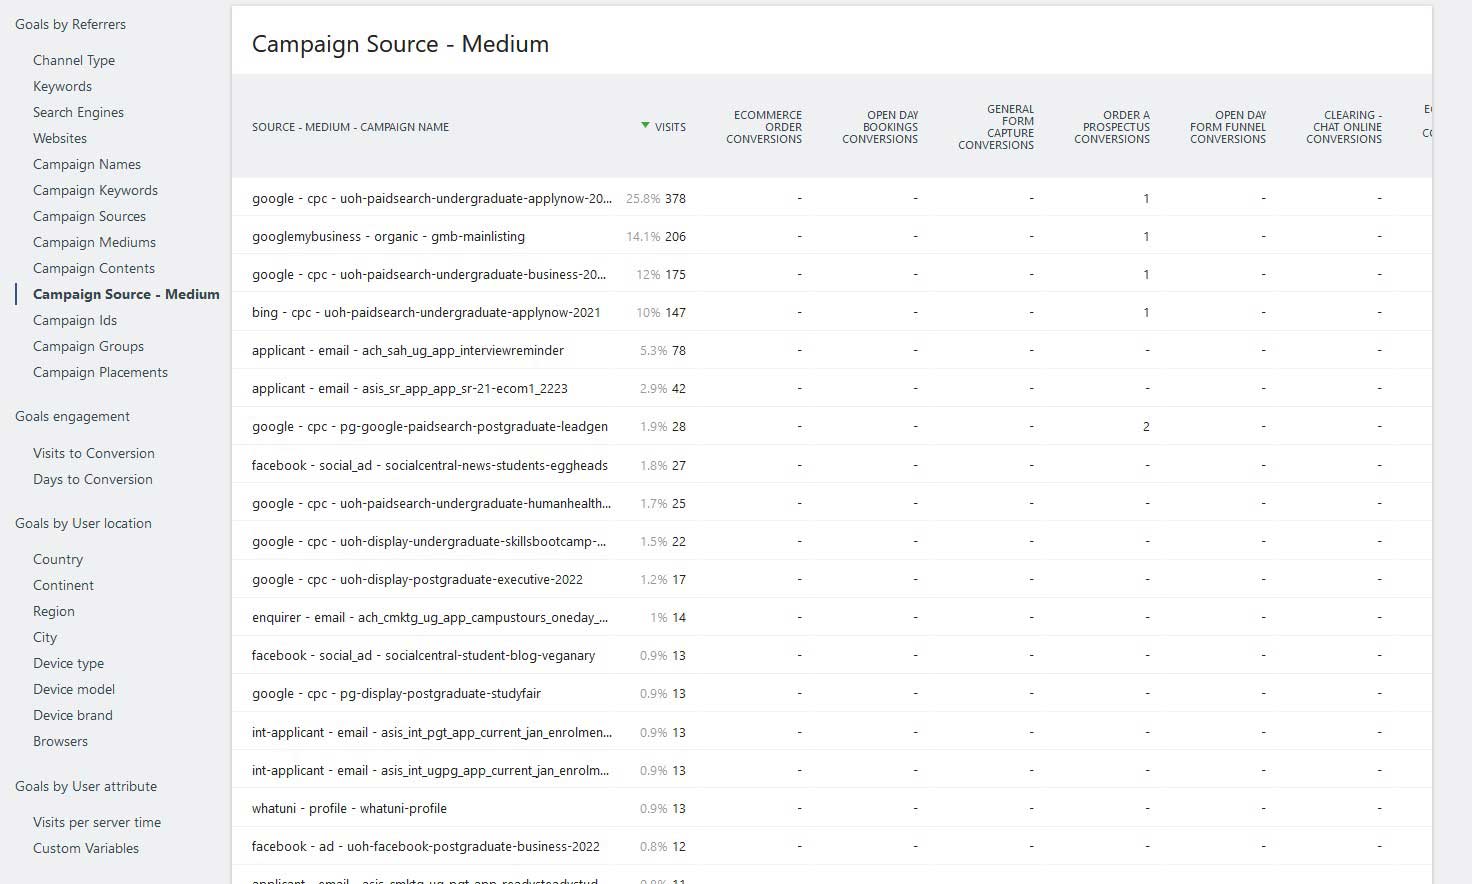
Table with Goal metrics
Shows the dimension along with a number of metrics for each goal we have setup in Matomo.
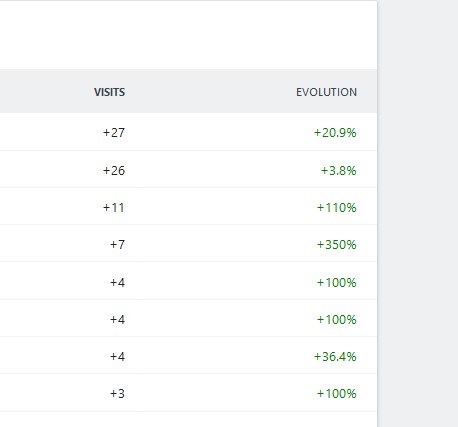
Insights
This seems to show if the dimension increased or decreased compared to the previous period.
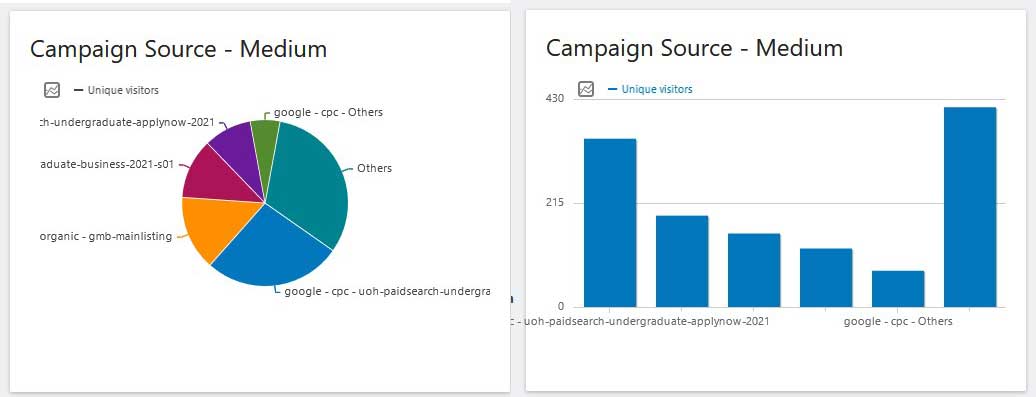
Graphs
These are probably not going to be all that useful as they only show the top few results and roll the rest up into an “other” option.
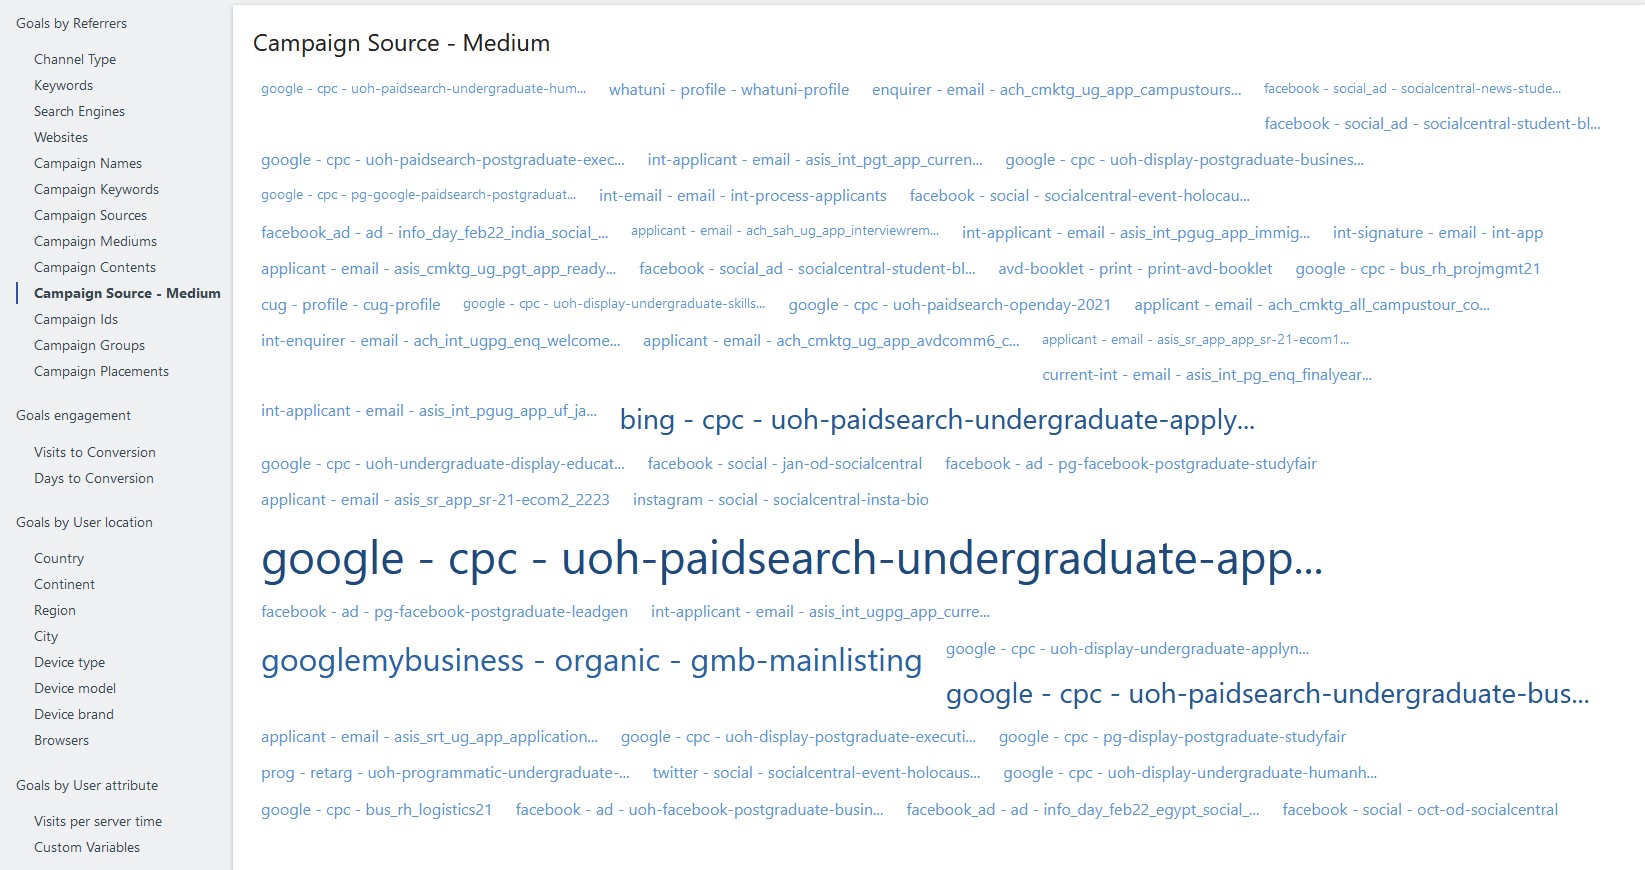
Tag Cloud
This shows all of the results in a Tag Cloud. So the higher the stats a dimension has the bigger it appears in the cloud.
Again, probably not all that useful, unless you need some filler content for a report.
Cog – Settings
The settings cog has a number of options displayed as binary statements.
- The report is flat (link to make is hierarchical)
- Dimensions are combined (link to make them separate)
- Aggregate rows are hidden (show them)
- All rows are shown (exclude low population)
- This report is not pivoted (pivot by campaign name)
That’s a lot of confusion there, so let’s go through them.
Flat report vs hierarchical report
In a flat report every individual item is displayed on it’s own line. They are then sorted by the metric you have chosen to sort by such as visitors in descending order.
In a hierarchical report the items are grouped into a relevant hierarchy which will all depend on the specific report you’re looking at.
If you’re looking at the Page report then it will put the items into the site hierarchy. This can be useful for navigating to the page you’re looking for as it matches where the journey on our website.
In my example I’m looking at the Goal report, specifically the Campaign Source Medium. So in this instance hierarchical groups the campaigns into source/medium.
Try both layouts and see which you prefer.
Dimensions are combined
In the flat report this lets you combine your dimensions into either one column or split into multiple columns.
Again, play with it and see what you prefer.
Aggregate rows are hidden
Matomo has auto hidden some rows that don’t have all of their dimensions. If you’re missing some stats then try unhiding.
All rows are shown (exclude low population)
To focus on only the top performing rows you can ‘exclude low population’ which means Matomo hides the lowest performing items in the table.

Nate Smith
Web Content Analyst, assigned to the Digital Content Team
Expert in web content, site architecture, analytics and content strategy. If you have any questions about these subjects please contact the Digital Content Team on digitalcontent@hud.ac.uk
Link Tracking Manual
Return to the Link Tracking Manual.